
The idea behind it
Reference-class forecasting estimates a project by looking at how similar past projects turned out, rather than by building the estimate up from the project's own plan. Daniel Kahneman and Amos Tversky described the planning fallacy, the tendency to underestimate time and cost even when past tasks ran over. Kahneman called the plan-based estimate the inside view and the record of similar projects the outside view. Bent Flyvbjerg turned the outside view into a method for large projects, and it is now used for public infrastructure and IT programs.
The method has three steps. Choose a reference class of past projects similar enough to the new one. Find the distribution of their outcomes, here the ratio of actual duration to initial estimate. Apply that distribution to the new project's initial estimate to get a range. The team's own estimate is not discarded; it is corrected by how far comparable estimates have been off before. Quoting the result as low, likely and high, rather than one date, shows stakeholders the uncertainty that a single figure hides. Barry Boehm and later Steve McConnell called this narrowing range the cone of uncertainty.
What's inside
- A short explanation of reference-class forecasting in three steps.
- Step 1, a log of past projects: type, initial estimate, actual, the ratio of the two, scope changes, complexity, team size, year completed and notes, shown with ten sample projects.
- Step 2, the distribution of ratios: minimum, 10th percentile, median, 90th percentile, maximum and average, with percentiles calculated as Excel's PERCENTILE.INC does.
- Step 3, the ratios applied to a new estimate, with the wording to give stakeholders.
- The Excel version has a log sheet that calculates the ratios and their statistics, a sample sheet, and a new-project estimator that reads the log's statistics and calculates the range.
Format: PDF (2 pages) and Excel workbook.
A look inside
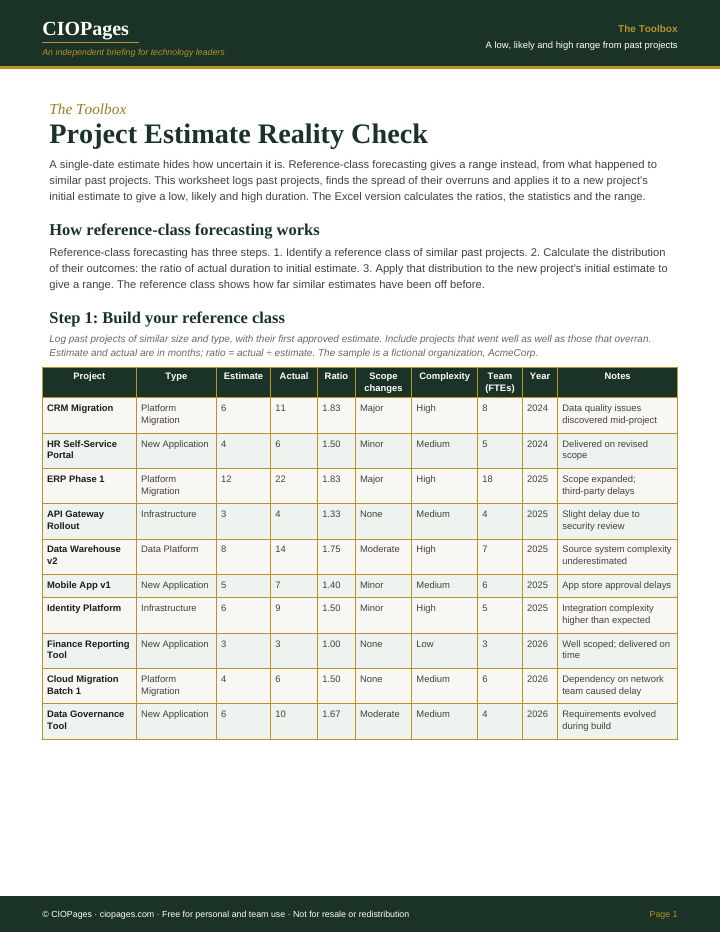
Page 1 of 2 of the PDF. Select an image to enlarge it.
Who uses it
- PMO leads, to replace single-date estimates in business cases with a range based on the organization's own delivery record.
- Program and project managers, to explain a longer timeline to sponsors with evidence instead of padding.
- CIOs, to check whether a proposed project's estimate is in line with how similar projects have actually run.
- Portfolio and finance partners, to set contingency for a portfolio from observed overrun ratios.
When to use it
- A business case needs a delivery date before detailed planning is done.
- A sponsor asks for a commitment on a migration or platform project similar to ones that overran before.
- A steering committee reviews a project that is already past its original estimate and asks for a new one.
- Annual portfolio planning, when several initial estimates need a consistent adjustment.
How to use it
Log your own past projects, then quote the range from the estimator instead of a single date.
- On the Reference Class Log sheet, enter past projects of similar size and type with their initial estimate and actual duration in months. The Ratio column calculates actual divided by estimate.
- Include projects that went well as well as those that overran, and record scope changes, complexity, team size, year completed and notes for each.
- Read the minimum, 10th percentile, median, 90th percentile, maximum and average ratio in the summary statistics under the log. The Sample sheet shows the same statistics for ten example projects.
- On the New Project Estimator sheet, enter the project name, type and your initial estimate. The 10th percentile, median and 90th percentile ratios are read from the log's summary statistics.
- Read the low, likely and high estimates, the range width, and the overrun risk, which is rated high when the median ratio is 1.5 or more.
- Give stakeholders the range in the wording shown in the PDF's Step 3: between the low and high figures, most likely the median figure.
You leave with: A low, likely and high duration for the new project, each tied to a ratio drawn from your own past projects, and a sentence to present it with.
Where it goes wrong
- Logging only the projects that went well, or using re-baselined estimates instead of the first estimate. Either shrinks the ratios and makes the range look tighter than it is.
- Choosing a reference class that is too broad, such as mixing small upgrades with ERP programs, so the ratios describe no project in particular.
- Presenting the likely figure alone once the range is calculated, which turns the range back into a single date.
- Basing the range on two or three projects. A few data points give unstable percentiles; the log has room for fifteen.
Get the worksheet
It is free. Enter your work email and we send the download link.
Questions
What is reference-class forecasting?
Reference-class forecasting predicts a project's outcome from the actual results of similar past projects. You find how far those projects ran over their estimates and apply that spread to the new estimate. It was developed from Kahneman and Tversky's work on the planning fallacy and put into practice by Bent Flyvbjerg.
How many past projects do you need for a reference class?
More is better, and the projects matter more than the count. They should be similar in type and size to the new one. Ten comparable projects, as in the worksheet's sample, give a usable spread; with only a few, treat the percentiles as rough.
What is the difference between the inside view and the outside view?
The inside view estimates a project from its own plan, tasks and team. The outside view estimates it from how similar projects actually turned out. Kahneman found the inside view is usually optimistic, and the outside view corrects it.