
The idea behind it
Technical debt is the future cost of shortcuts and aging design in software. Ward Cunningham coined the metaphor in 1992 to explain to business colleagues why code that ships quickly needs to be revisited. Like financial debt, it carries interest: each change to an indebted system takes longer and breaks more often. The trouble is that debt is hard to see. Teams are often asked to rate it on a 1-to-5 scale, and those ratings reflect mood, tenure and who is in the room more than the state of the code.
A signals approach replaces opinion with measurement. It watches the symptoms debt produces, such as failed changes, slow delivery, long recovery from incidents, repeat failures, old dependencies and unplanned work crowding out planned work. Four of these come from the DORA research program, described in Accelerate by Nicole Forsgren, Jez Humble and Gene Kim: change failure rate, lead time for changes, deployment frequency and time to restore service. Each signal gets a direction and thresholds, so a value lands in green, amber or red. No single number proves a service is indebted. A service that is red on several signals at once is where remediation money is most likely to pay back.
What's inside
- A Metric Specifications sheet with ten metrics, including change failure rate, lead time, restore time, deployment frequency, test coverage and dependency age.
- For each metric: category, definition, unit, direction, green, amber and red thresholds, and a data source. The thresholds are numbers you can change.
- A Service Scorecard sheet with one row per service, each value colored green, amber or red, and an overall red, amber or green status that calculates from the values.
- A sample scorecard with eight services for a fictional company.
Format: Excel workbook.
A look inside
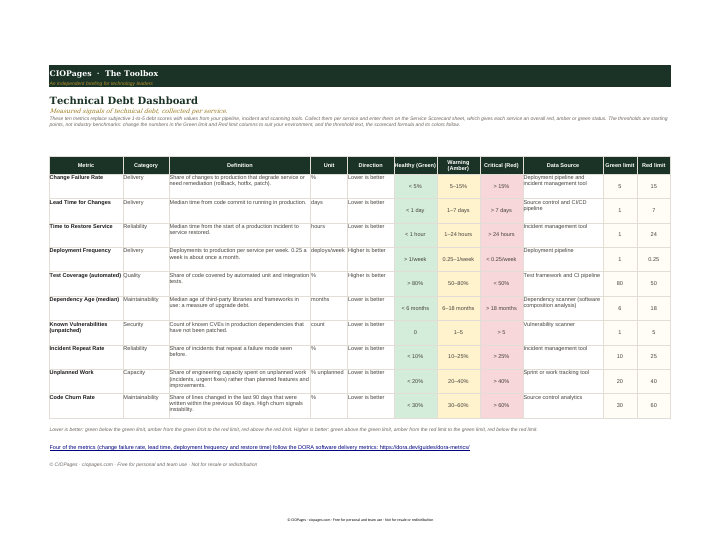
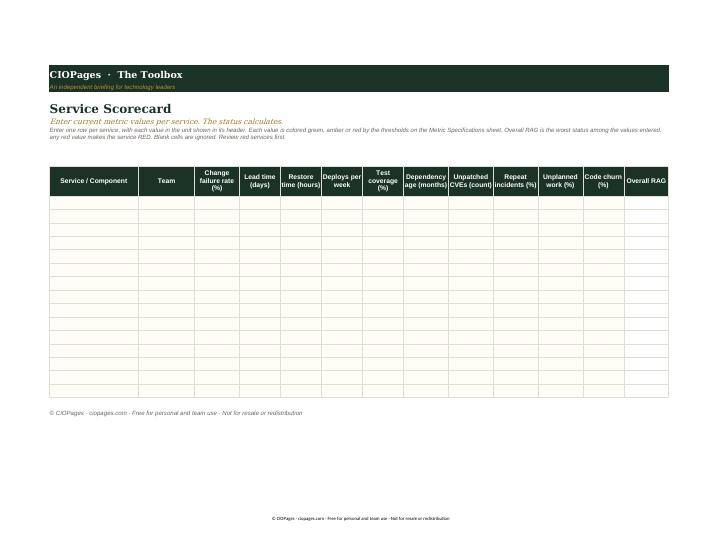
The first page. Select an image to enlarge it.
Who uses it
- CTOs and heads of engineering, to decide which services get remediation budget using values rather than team self-assessment.
- Platform and SRE leads, to see which services fail most often and take longest to restore.
- Engineering managers, to show product owners why a service needs time for upgrades and test coverage.
- Enterprise architects, to add measured evidence to application portfolio and modernization decisions.
When to use it
- Annual planning is setting the split between feature work and remediation.
- Several teams each claim their service has the worst technical debt.
- A legacy service keeps appearing in incident reviews and needs a case for modernization.
- A new engineering leader needs a baseline of service health across the estate.
- A modernization program needs a before-and-after measure of whether debt went down.
How to use it
Collect the ten values per service from your pipeline, incident and scanning tools, and review the scorecard on a regular cycle.
- Read the Metric Specifications sheet and confirm each of the ten definitions, units and thresholds suits your environment.
- Map each metric to the tool named in its Data Source column, such as the deployment pipeline, incident management tool or dependency scanner.
- In the Service Scorecard sheet, enter one row per service with its team and the ten values in the units shown in the column headers.
- Read the Overall RAG column, which shows the worst status among the values entered: any red signal makes the service RED.
- Compare your results with the Sample sheet to check that values are entered in the right units.
- Review red services first, then recollect the values on a fixed cycle to see whether remediation moved them.
You leave with: A per-service table of ten measured debt signals with an overall red, amber or green status that can be recalculated each review cycle.
Where it goes wrong
- Mixing units, such as entering lead time in hours where the sheet expects days, which shifts services into the wrong band.
- Treating one red signal as the whole diagnosis; the overall status is a worst-of roll-up, so check which metrics drove it.
- Collecting the values once and never again, which loses the trend that shows whether remediation worked.
- Using the scorecard to rank teams rather than services, which invites teams to tune the numbers instead of the code.
Get the metrics spreadsheet
It is free. Enter your work email and we send the download link.
Questions
How do you measure technical debt?
Measure its symptoms per service instead of asking teams to rate it. Common signals are change failure rate, lead time for changes, time to restore service, deployment frequency, test coverage, dependency age and the share of unplanned work. Thresholds turn each value into green, amber or red.
Are DORA metrics a measure of technical debt?
Not directly. DORA metrics measure software delivery performance, and debt is one of the things that degrades it. They work best as debt signals when combined with code-level measures such as dependency age, test coverage, unpatched vulnerabilities and churn.
Why not score technical debt on a 1-to-5 scale?
Subjective scores vary with who answers and cannot be checked or tracked reliably. Measured signals come from pipeline, incident and scanning tools, so two people get the same value. They also show change over time.