
What's inside
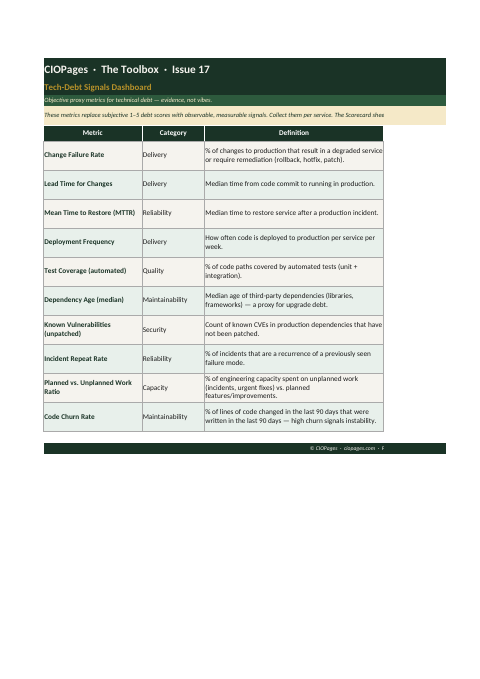
- A Metric Specifications sheet with ten metrics, including change failure rate, lead time, restore time, deployment frequency, test coverage and dependency age.
- For each metric: category, definition, unit, direction, green, amber and red thresholds, and a data source.
- A Service Scorecard sheet with one row per service and an overall red, amber or green status that calculates from the values.
- A sample scorecard with eight services for a fictional company.
Format: Excel workbook.
How to use it
Collect the ten values per service from your pipeline, incident and scanning tools, and review the scorecard on a regular cycle.
Get the metrics spreadsheet
It is free. We email the download link to your work address.