
The idea behind it
A 2x2 matrix sorts a long list into four groups that call for different decisions. Value goes on one axis. The other is whatever limits what can be done: effort when capacity and cost are the constraint, risk when delivery or operational risk is. High value and low effort are quick wins, high value and high effort are big bets that need a plan, low value and low effort are fill-ins, and low value and high effort are money pits.
The matrix is only as good as its scales. Without written definitions, one person's 4 is another's 2 and the chart reflects who argued hardest. This worksheet gives each score from 1 to 5 a description, to be rewritten for your organization before anyone scores and then kept fixed. A score of 3 on either axis puts an initiative on the line, so the room decides which side it falls on and records why. The quadrant suggests an action; the decision column records what was agreed.
What's inside
- Written 1-to-5 scales for value, effort and risk, editable before scoring.
- A placement rule: 4 or 5 is high, 1 or 2 is low, and a 3 on either axis puts the initiative on the line to be decided in the room.
- The four quadrants for each second axis, with a suggested action: quick wins, big bets, fill-ins and money pits for effort; safe bets, bets to de-risk, low-stakes options and avoid for risk.
- A scoring table for up to 20 initiatives: owner, the three scores, confidence, rationale and decision.
- An Excel version that calculates the quadrant and a value ratio, counts each quadrant and plots every initiative on a scatter chart, with a switch between effort and risk.
- A worked example of 10 fictional IT initiatives, and slides to present the matrix and the decisions.
Format: PDF (4 pages), Excel workbook and PowerPoint file.
A look inside
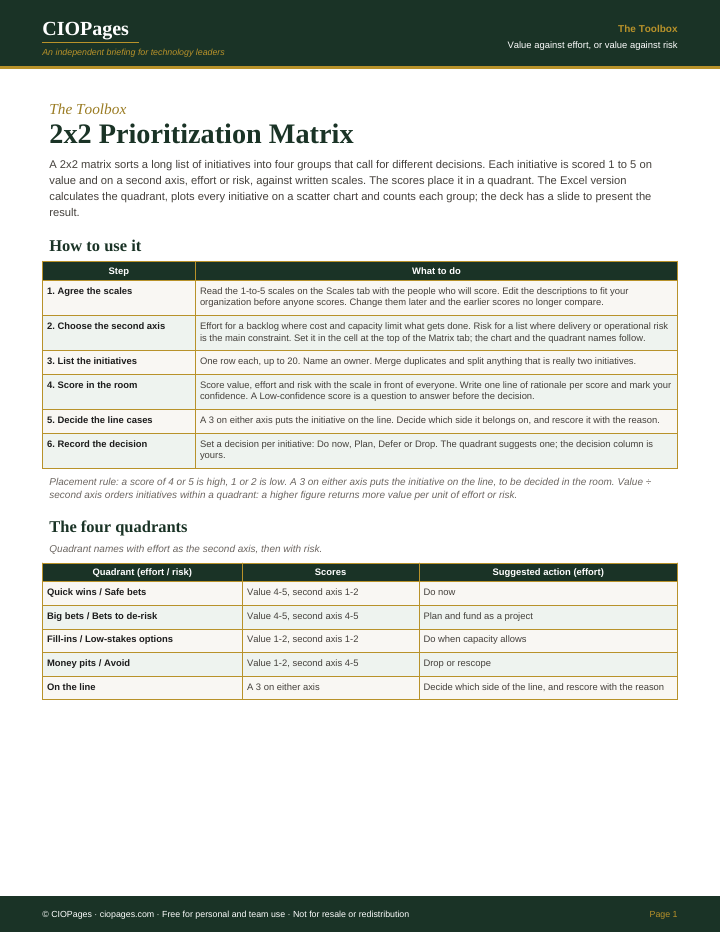
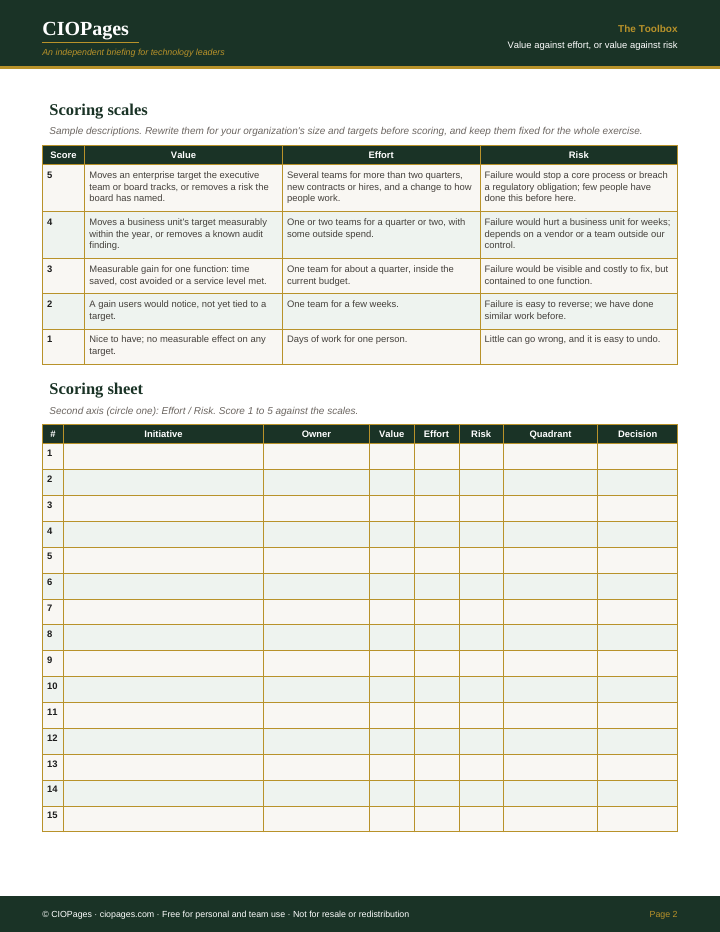
Pages 1 and 2 of 4 of the PDF. Select an image to enlarge it.
Who uses it
- CIOs and IT leadership teams, to agree what to fund, defer or stop from a backlog that exceeds capacity.
- PMO and portfolio managers, to run a scoring session and present the result to a steering committee.
- Business relationship managers, to show a business unit why its requests landed where they did.
- FinOps and finance partners, to see which spend sits in initiatives scored low value.
When to use it
- The annual or quarterly planning cycle, when the backlog is larger than the budget.
- A new leader inherits a list of projects and requests with no agreed order.
- A cost-reduction target means some work has to stop.
- A steering committee needs to see the whole backlog on one page.
How to use it
Score a backlog in one session with the people who own it, then present the matrix and the proposed decisions from the deck.
- Rewrite the value, effort and risk scales for your organization, and agree them before scoring.
- Choose effort or risk as the second axis.
- List up to 20 initiatives with an owner each, merging duplicates.
- Score each one in the room against the scales, with a line of rationale and a confidence level.
- Decide the initiatives on the line and rescore them with the reason.
- Record a decision for each: do now, plan, defer or drop. Present the matrix and the decisions from the deck.
You leave with: A scored and plotted backlog, a count of initiatives in each quadrant, and a recorded decision with a reason for every initiative.
Where it goes wrong
- Scoring without written scales, so the scores measure who spoke last.
- Changing the scales halfway through, so early and late scores no longer compare.
- Treating the quadrant as the decision. Mandatory work, such as an end-of-support upgrade, can sit in any quadrant.
- Scoring effort on work already spent instead of work left to do.
Get the worksheet
It is free. Enter your work email and we send the download link.
Questions
Should the second axis be effort or risk?
Effort when capacity and cost limit what gets done, which is the usual case for an IT backlog. Risk when the main constraint is delivery or operational risk, such as changes to core systems. The Excel version switches between the two.
What happens to an initiative that scores 3?
A 3 on either axis puts it on the line. The worksheet asks the group to decide which side it belongs on and to rescore it with the reason, so borderline items get a discussion instead of a default.
How many initiatives can one matrix hold?
The workbook holds 20. Beyond that, the chart gets crowded and the session long; split the backlog by portfolio or business unit and run one matrix each.